
Analytics

The BRSN Analytics department works directly with Cornell's varsity athletic teams to provide analytical insights and assistance. We currently have project teams working with Men's Basketball, Baseball, and Football on projects ranging from weekly lineup analyses to automated shot tracking programs. We offer the opportunity for anyone with any level of experience to get hands-on experience while supporting Cornell's teams.
Basketball Project
Using data collected in-game, the Basketball analytics team uses software to create effective lineups and player traits that push Cornell's basketball team towards success.

An interface created by the basketball analytics team that displays game data from a player
Baseball Project
The Baseball analytics team collects data from Cornell's games as well as their opponents. This helps the team practice and prepare for their games.
The Baseball Analytics team meets weekly and has constant communication with the Baseball coaches to deliver scouting reports based on team and player statistics. They also create scouting reports for opposing teams, allowing the team to have a better understanding of who they are playing
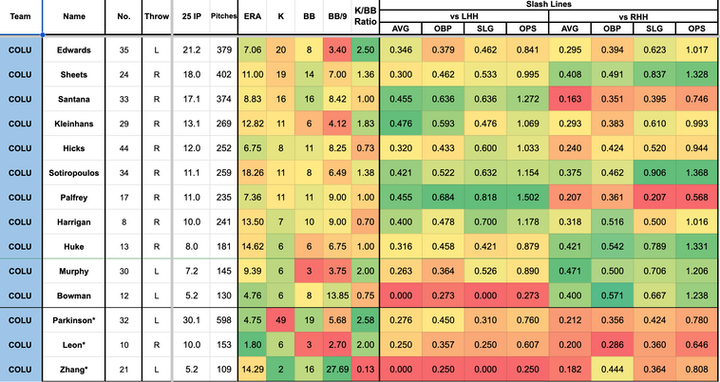
A scouting report of Columbia's hitters with splits versus both Left and Right handed batters

The template that the team uses to deliver scouting reports to the coaching staff
Football Project
The football analytics team created a simple front end interface in which coaches can input game data. This data is then processed by a backend program. The processed data is then presented in a way that is easily understandable, providing more nuanced statistics and graphs.

An example of a chart that can be generated from game data using the software developed by the football analytics team